RSI + ADX + ATR 18-01-25Combining RSI (Relative Strength Index), ADX (Average Directional Index), and ATR (Average True Range) creates a synergistic approach to technical analysis. This powerful trio covers momentum, trend strength, and volatility, providing comprehensive insights into market conditions. Here's a deeper exploration of their combined results:
1. Momentum Assessment with RSI
Purpose: RSI measures the speed and magnitude of recent price changes to determine overbought or oversold levels.
Benefit in Combination:
When RSI indicates overbought (above 70) or oversold (below 30) levels, it signals a potential reversal or correction.
However, these signals can be false in strongly trending markets, which is why ADX is used alongside it.
2. Trend Strength Confirmation with ADX
Purpose: ADX confirms the presence and strength of a trend.
Benefit in Combination:
If RSI shows a potential reversal but ADX indicates a strong trend (above 25), the trend is likely to continue, and RSI signals may need to be approached with caution.
Conversely, if ADX is below 20 (weak trend), RSI signals are more likely to indicate genuine reversals, as the market lacks a strong directional push.
3. Volatility Analysis with ATR
Purpose: ATR evaluates the level of price volatility.
Benefit in Combination:
High ATR values indicate volatile conditions where prices can move significantly; this helps in setting wider stop-loss levels to avoid premature exits.
Low ATR values suggest quieter markets, where tighter stop-losses and profit targets are more suitable.
Wyszukaj w skryptach "relative strength"

StockInfo ManualScript Description:
The StockInfo Manual is designed to display detailed stock information directly on the chart for the selected symbol. It processes user-provided input data, including
stock symbols
Industries
Relative Strength (RS) values
Band information
Key Features:
1. Symbol-Specific Data Display: Displays information only for the current chart symbol.
2. Customizable Table: Adjust the table's position, text size, colors, and headers to match your preferences.
3. Low RS/Band Conditions: Highlights critical metrics (RS < 50 or Band < 6) with a red background for quick visual cues.
4. Toggle Information: Choose to show or hide RS, Band, and Industry columns based on your needs.
How to Use the Script:
1. Use any platform (ex: chartsmaze) to get Industry,RS and Band information of any Stock. Prepare the data as separate column of excel
2. Configure Inputs:
- Stock Symbols (`Stock`): Enter a comma-separated list of stock symbols (e.g.,
NSE:ABDL,
NSE:ABFRL,
NSE:ABREL,
NSE:ABSLAMC,
NSE:ACC,
NSE:ACE,
- Industries (`Industry`): Provide a comma-separated list of industries for the stocks (e.g., 103-Brewerie,
109-Retail-D,
92-Paper & ,
19-Asset Ma,
62-Cement,
58-Industri,
- Relative Strength (`RS`): Input RS values for each stock (e.g.,
83,
52,
51,
81,
23,
59,
- Band Information (`Band`): Specify Band values for each stock. Use "No Band" if 10,
No Band,
20,
20,
No Band,
20,
3. Customize the Table:
-Display Options: Toggle the visibility of `RS`, `Band`, and `Industry` using the input checkboxes.
-Position and Appearance: Choose the table's position on the chart (e.g., top-right, bottom-center). Customize text size, background colors, header display, and other visual elements.
4. Interpret the Table:
- The table will dynamically display information for the current chart symbol only.
- If the `RS` is below 50 or the Band is below 6, the corresponding row is highlighted with a red background for immediate attention.
One need to enter details at least weekly for a correct result

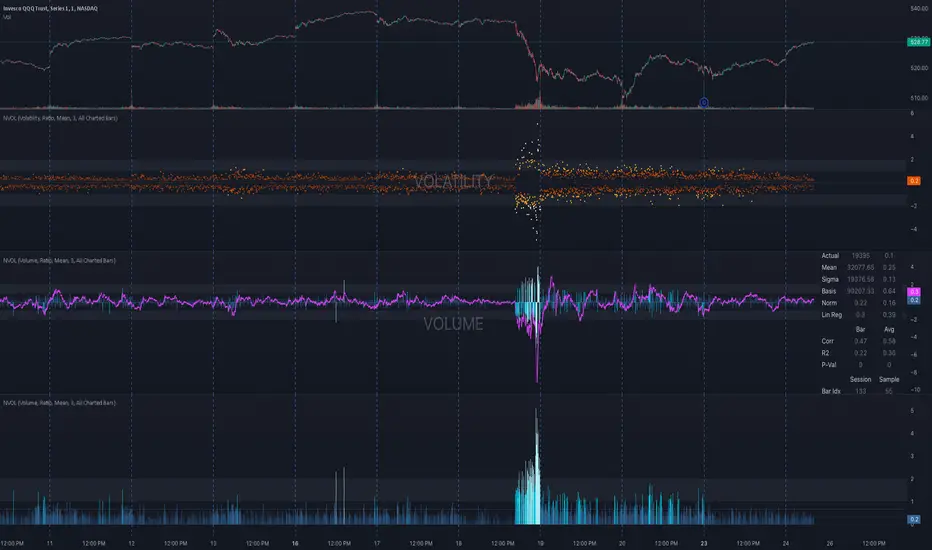
NVOL Normalized Volume & VolatilityOVERVIEW
Plots a normalized volume (or volatility) relative to a given bar's typical value across all charted sessions. The concept is similar to Relative Volume (RVOL) and Average True Range (ATR), but rather than using a moving average, this script uses bar data from previous sessions to more accurately separate what's normal from what's anomalous. Compatible on all timeframes and symbols.
Having volume and volatility processed within a single indicator not only allows you to toggle between the two for a consistent data display, it also allows you to measure how correlated they are. These measurements are available in the data table.
DATA & MATH
The core formula used to normalize each bar is:
( Value / Basis ) × Scale
Value
The current bar's volume or volatility (see INPUTS section). When set to volume, it's exactly what you would expect (the volume of the bar). When set to volatility, it's the bar's range (high - low).
Basis
A statistical threshold (Mean, Median, or Q3) plus a Sigma multiple (standard deviations). The default is set to the Mean + Sigma × 3 , which represents 99.7% of data in a normal distribution. The values are derived from the current bar's equivalent in other sessions. For example, if the current bar time is 9:30 AM, all previous 9:30 AM bars would be used to get the Mean and Sigma. Thus Mean + Sigma × 3 would represent the Normal Bar Vol at 9:30 AM.
Scale
Depends on the Normalize setting, where it is 1 when set to Ratio, and 100 when set to Percent. This simply determines the plot's scale (ie. 0 to 1 vs. 0 to 100).
INPUTS
While the default configuration is recommended for a majority of use cases (see BEST PRACTICES), settings should be adjusted so most of the Normalized Plot and Linear Regression are below the Signal Zone. Only the most extreme values should exceed this area.
Normalize
Allows you to specify what should be normalized (Volume or Volatility) and how it should be measured (as a Ratio or Percentage). This sets the value and scale in the core formula.
Basis
Specifies the statistical threshold (Mean, Median, or Q3) and how many standard deviations should be added to it (Sigma). This is the basis in the core formula.
Mean is the sum of values divided by the quantity of values. It's what most people think of when they say "average."
Median is the middle value, where 50% of the data will be lower and 50% will be higher.
Q3 is short for Third Quartile, where 75% of the data will be lower and 25% will be higher (think three quarters).
Sample
Determines the maximum sample size.
All Charted Bars is the default and recommended option, and ignores the adjacent lookback number.
Lookback is not recommended, but it is available for comparisons. It uses the adjacent lookback number and is likely to produce unreliable results outside a very specific context that is not suitable for most traders. Normalization is not a moving average. Unless you have a good reason to limit the sample size, do not use this option and instead use All Charted Bars .
Show Vol. name on plot
Overlays "VOLUME" or "VOLATILITY" on the plot (whichever you've selected).
Lin. Reg.
Polynomial regressions are great for capturing non-linear patterns in data. TradingView offers a "linear regression curve", which this script uses as a substitute. If you're unfamiliar with either term, think of this like a better moving average.
You're able to specify the color, length, and multiple (how much to amplify the value). The linear regression derives its value from the normalized values.
Norm. Val.
This is the color of the normalized value of the current bar (see DATA & MATH section). You're able to specify the default, within signal, and beyond signal colors. As well as the plot style.
Fade in colors between zero and the signal
Programmatically adjust the opacity of the primary plot color based on it's normalized value. When enabled, values equal to 0 will be fully transparent, become more opaque as they move away from 0, and be fully opaque at the signal. Adjusting opacity in this way helps make difference more obvious.
Plot relative to bar direction
If enabled, the normalized value will be multiplied by -1 when a bar's open is greater than the bar's close, mirroring price direction.
Technically volume and volatility are directionless. Meaning there's really no such thing as buy volume, sell volume, positive volatility, or negative volatility. There is just volume (1 buy = 1 sell = 1 volume) and volatility (high - low). Even so, visually reflecting the net effect of pricing pressure can still be useful. That's all this setting does.
Sig. Zone
Signal zones make identifying extremes easier. They do not signal if you should buy or sell, only that the current measurement is beyond what's normal. You are able to adjust the color and bounds of the zone.
Int. Levels
Interim levels can be useful when you want to visually bracket values into high / medium / low. These levels can have a value anywhere between 0 and 1. They will automatically be multiplied by 100 when the scale is set to Percent.
Zero Line
This setting allows you to specify the visibility of the zero line to best suit your trading style.
Volume & Volatility Stats
Displays a table of core values for both volume and volatility. Specifically the actual value, threshold (mean, median, or Q3), sigma (standard deviation), basis, normalized value, and linear regression.
Correlation Stats
Displays a table of correlation statistics for the current bar, as well as the data set average. Specifically the coefficient, R2, and P-Value.
Indices & Sample Size
Displays a table of mixed data. Specifically the current bar's index within the session, the current bar's index within the sample, and the sample size used to normalize the current bar's value.
BEST PRACTICES
NVOL can tell you what's normal for 9:30 AM. RVOL and ATR can only tell you if the current value is higher or lower than a moving average.
In a normal distribution (bell curve) 99.7% of data occurs within 3 standard deviations of the mean. This is why the default basis is set to "Mean, 3"; it includes the typical day-to-day fluctuations, better contextualizing what's actually normal, minimizing false positives.
This means a ratio value greater than 1 only occurs 0.3% of the time. A series of these values warrants your attention. Which is why the default signal zone is between 1 and 2. Ratios beyond 2 would be considered extreme with the default settings.
Inversely, ratio values less than 1 (the normal daily fluctuations) also tell a story. We should expect most values to occur around the middle 3rd, which is why interim levels default to 0.33 and 0.66, visually simplifying a given move's participation. These can be set to whatever you like and only serve as visual aids for your specific trading style.
It's worth noting that the linear regression oscillates when plotted directionally, which can help clarify short term move exhaustion and continuation. Akin to a relative strength index (RSI), it may be used to inform a trading decision, but it should not be the only factor.
AI indicatorThis script is a trading indicator designed for future trading signals on the TradingView platform. It uses a combination of the Relative Strength Index (RSI) and a Simple Moving Average (SMA) to generate buy and sell signals. Here's a breakdown of its components and logic:
1. Inputs
The script includes configurable inputs to make it adaptable for different market conditions:
RSI Length: Determines the number of periods for calculating RSI. Default is 14.
RSI Overbought Level: Signals when RSI is above this level (default 70), indicating potential overbought conditions.
RSI Oversold Level: Signals when RSI is below this level (default 30), indicating potential oversold conditions.
Moving Average Length: Defines the SMA length used to confirm price trends (default 50).
2. Indicators Used
RSI (Relative Strength Index):
Measures the speed and change of price movements.
A value above 70 typically indicates overbought conditions.
A value below 30 typically indicates oversold conditions.
SMA (Simple Moving Average):
Used to smooth price data and identify trends.
Price above the SMA suggests an uptrend, while price below suggests a downtrend.
3. Buy and Sell Signal Logic
Buy Condition:
The RSI value is below the oversold level (e.g., 30), indicating the market might be undervalued.
The current price is above the SMA, confirming an uptrend.
Sell Condition:
The RSI value is above the overbought level (e.g., 70), indicating the market might be overvalued.
The current price is below the SMA, confirming a downtrend.
These conditions ensure that trades align with market trends, reducing false signals.
4. Visual Features
Buy Signals: Displayed as green labels (plotshape) below the price bars when the buy condition is met.
Sell Signals: Displayed as red labels (plotshape) above the price bars when the sell condition is met.
Moving Average Line: A blue line (plot) added to the chart to visualize the SMA trend.
5. How It Works
When the buy condition is true (RSI < 30 and price > SMA), a green label appears below the corresponding price bar.
When the sell condition is true (RSI > 70 and price < SMA), a red label appears above the corresponding price bar.
The blue SMA line helps to visualize the overall trend and acts as confirmation for signals.
6. Advantages
Combines Momentum and Trend Analysis:
RSI identifies overbought/oversold conditions.
SMA confirms whether the market is trending up or down.
Simple Yet Effective:
Reduces noise by using well-established indicators.
Easy to interpret for beginners and experienced traders alike.
Customizable:
Parameters like RSI length, oversold/overbought levels, and SMA length can be adjusted to fit different assets or timeframes.
7. Limitations
Lagging Indicator: SMA is a lagging indicator, so it may not capture rapid market reversals quickly.
Not Foolproof: No trading indicator can guarantee 100% accuracy. False signals can occur in choppy or sideways markets.
Needs Volume Confirmation: The script does not consider trading volume, which could enhance signal reliability.
8. How to Use It
Copy the script into TradingView's Pine Editor.
Save and add it to your chart.
Adjust the RSI and SMA parameters to suit your preferred asset and timeframe.
Look for buy signals (green labels) in uptrends and sell signals (red labels) in downtrends.

[blackcat] L2 Waveband Trading█ OVERVIEW
The Waveband Trading script calculates trading signals based on a modified Relative Strength Index (RSI)-like system combined with specific price action criteria. It plots two lines representing different smoothed RSI-like indicators and marks potential buying opportunities labeled as "S" for stronger trends and "B" for weaker but still favorable ones.
█ LOGICAL FRAMEWORK
The script begins by defining the waveband_trading_signals function which computes RSI-like metrics and determines buy signals under certain conditions. The main sections include input parameter definitions, function calls, data processing within the function, and plot commands for visual representation. Data flows from historical OHLCV data to various technical computations like EMAs and SMAs before being evaluated against user-defined thresholds to generate trade signals.
█ CUSTOM FUNCTIONS
Waveband Trading Signals:
• Purpose: Computes waveband trading signals using a customized version of the RSI indicator.
• Parameters:
— overboughtLevel: Threshold level indicating market overbought condition.
— oversoldLevel: Threshold level indicating market oversold condition.
— strongHoldLevel: Strong hold condition threshold between neutral and overbought states.
— moderateHoldLevel: Moderate hold condition threshold below strong hold level.
• [b>Returns: A tuple containing:
— k: Smoothed RSI-like metric.
— d: Further smoothed version of 'k'.
— buySignalStrong: Boolean indicating a strong trend buy signal.
— buySignalWeak: Boolean indicating a weak but promising buy signal.
█ KEY POINTS AND TECHNIQUES
• Utilizes EMA and SMA functions to smooth out price variations effectively.
• Employs crossover logic between fast ('k') and slow ('d') indicators to identify entry points.
• Incorporates volume checks ensuring increasing interest in trades aligns with upwards momentum.
• Leverages predefined threshold levels allowing flexibility to adapt to varying market conditions.
• Uses the new labeling feature ( label.new ) introduced in Pine Script v5 for marking significant chart events visually.
█ EXTENDED KNOWLEDGE AND APPLICATIONS
Potential enhancements could involve incorporating additional filters such as MACD crossovers or Fibonacci retracement levels alongside optimizing current conditions via backtesting. This technique might also prove useful in other strategies requiring robust confirmation methods beyond simple price action; alternatively, adapting it into a more automated form for execution on exchanges offering API access. Understanding key functionalities like relative strength assessment, smoothed averaging techniques, and conditional buy/sell rules enriches one’s toolkit when developing complex trading algorithms tailored specifically toward personal investment philosophies.

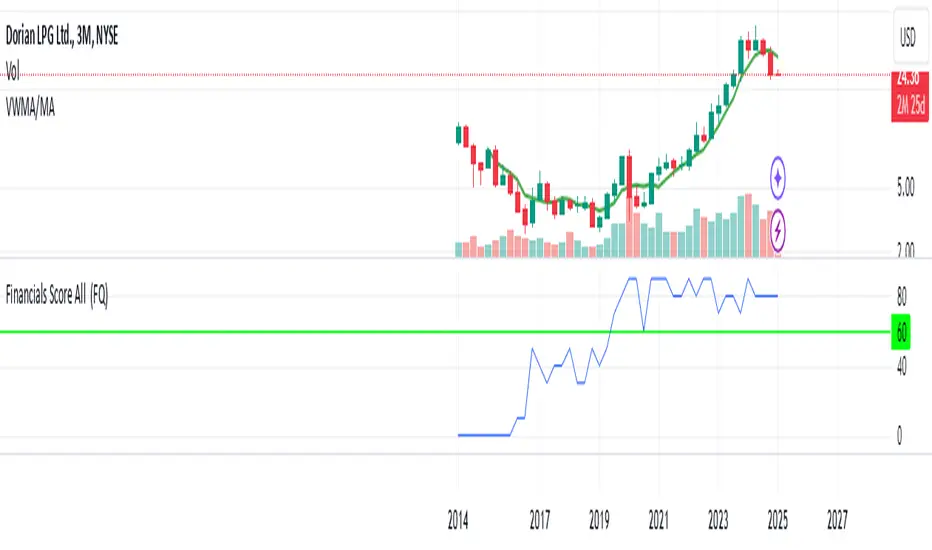
Financials Score All Description of the "Financials Score All" Script
This Pine Script calculates a financial score for a specific stock, based on various financial metrics. The purpose is to provide a comprehensive numerical score that reflects the financial health of the stock. The score is calculated using multiple financial indicators, including profitability, valuation, debt management, and liquidity. Here’s a breakdown of what each part of the script does:
period = input.string('FQ', 'Period', options= )
FQ refers to Quarterly financial data.
FY refers to Fiscal Year financial data.
Financial Metrics:
The script uses various financial metrics to calculate the score. These are obtained via request.financial, which retrieves financial data for the stock from TradingView's database. Below are the metrics used:
opmar (Operating Margin): Measures the company's profitability as a percentage of revenue.
eps (Earnings Per Share): Represents the portion of a company's profit allocated to each outstanding share.
eps_ttm (Earnings Per Share – Trailing Twelve Months): EPS over the most recent 12 months.
pe_ratio (Price-to-Earnings Ratio): A measure of the price investors are willing to pay for a stock relative to its earnings.
pb_ratio (Price-to-Book Ratio): A valuation ratio comparing a company’s market value to its book value.
de_ratio (Debt-to-Equity Ratio): A measure of the company’s financial leverage, showing how much debt it has compared to shareholders' equity.
roe_pb (Return on Equity Adjusted to Book): Measures the company's profitability relative to its book value.
fcf_per_share (Free Cash Flow per Share): Represents the free cash flow available for dividends, debt reduction, or reinvestment, per share.
pfcf_ratio (Price-to-Free-Cash-Flow Ratio): A measure comparing a company’s market value to its free cash flow.
current_ratio (Current Ratio): A liquidity ratio that measures a company's ability to pay short-term obligations with its current assets.
RSI Calculation:
The script calculates the Relative Strength Index (RSI) for the stock using an 8-period lookback:
rsi = ta.rsi(close, 8)
Score Calculation:
The script calculates a total score by adding points based on the values of the financial metrics. Each metric is checked against a condition, and if the condition is met, the score is incremented:
If the Operating Margin (opmar) is greater than 20, the score is incremented by 20 points.
If Earnings Per Share (EPS) is positive, 10 points are added.
If the P/E ratio is between 0 and 20, 10 points are added.
If the P/B ratio is less than 3, 10 points are added.
If the Debt-to-Equity ratio is less than 0.8, 10 points are added.
If the Return on Equity Adjusted to Book is greater than 10, 10 points are added.
If the P/FCF ratio is between 0 and 15, 10 points are added.
If the Current Ratio is greater than 1.61, 10 points are added.
If the RSI is less than 35, 10 points are added.
The score is accumulated based on these conditions and stored in the total_score variable.
Displaying the Total Score:
Finally, the total score is plotted on the chart:
Summary of How It Works:
This script calculates a financial score for a stock using a variety of financial indicators. Each metric has a threshold, and when the stock meets certain criteria (for example, a good operating margin, a healthy debt-to-equity ratio, or a low P/E ratio), points are added to the overall score. The result is a single numerical value that reflects the financial health of the stock.
This score can help traders or investors identify companies with strong financials, or serve as a comparison tool between different stocks based on their financial health.
Generally >60 is the best stocks for med and long term trades
Max The Minner: RSI Bands with Min/Max [by Oberlunar]This Pine Script, titled "Max The Minner: RSI Bands with Min/Max " is a technical indicator designed to visualize RSI-based dynamic bands with local minimum and maximum levels on a chosen timeframe. The script incorporates user-configurable parameters for RSI thresholds, resolution, and color settings, providing traders with a highly customizable tool for analyzing price behavior in relation to overbought and oversold conditions.
Core Functionality
The script begins by calculating the RSI (Relative Strength Index) using user-defined inputs for overbought and oversold levels, the RSI length, and the resolution (default set to daily). The RSI is computed through an exponential moving average (EMA) approach that smooths the upward and downward price movements, creating adaptive upper (ub) and lower (lb) bands based on the overbought and oversold thresholds.
These bands are then dynamically adjusted based on the current price (src) and the EMA calculations. The upper band (ub) represents a potential resistance zone aligned with the RSI overbought level, while the lower band (lb) represents a support zone aligned with the RSI oversold level. The script employs additional calculations to ensure the adaptive nature of these bands, depending on whether the RSI is pushing higher or lower relative to its thresholds.
Local Minima and Maxima
A key feature of the indicator is its ability to track and update local minima and maxima based on the chosen timeframe. The script uses a buffer system that refreshes these levels every three bars to smooth out noise and avoid excessive sensitivity to short-term fluctuations. These local extrema (localMin and localMax) are retrieved from the lower and upper prices of the selected timeframe and act as dynamic benchmarks for evaluating the RSI bands.
Conditional Logic
The script includes conditional logic to determine when the RSI bands intersect with or approach the local maxima or minima. For example:
The upper band (ub) is plotted only if it is below the local maximum, suggesting that price may encounter resistance.
Similarly, the lower band (lb) is plotted only if it is above the local minimum, indicating potential support.
This logic ensures that the bands are contextually relevant to the prevailing market structure, rather than being static overlays.
Visualization
The RSI bands and local extrema are plotted on the chart using color-coded lines, with transparency adjustable through user inputs. The upper band and local maximum are linked with a fill area, visually representing the resistance zone. Similarly, the lower band and local minimum are filled to highlight the support zone. These fills provide a clear depiction of price boundaries, making it easier for traders to spot key levels.
Additionally, the script marks breakout conditions. If the price exceeds the local maximum, a label is plotted at the breakout point with a distinctive style and color. Similarly, a breakout below the local minimum is labeled, providing a visual cue for significant price movements.
Customization
The script offers extensive customization options for both functionality and appearance:
Users can define the overbought and oversold levels for RSI, along with the RSI length and the resolution (timeframe).
Colors for the upper and lower bands, along with transparency (alpha) levels, can be adjusted, allowing for seamless integration with different chart styles.
The periodicity of the local minima and maxima updates is hardcoded to three bars but could be further parameterized for greater flexibility.
This indicator is particularly useful for traders who rely on RSI-based strategies and need a dynamic representation of overbought and oversold conditions in conjunction with local price extremes. By combining RSI bands with the context provided by local minima and maxima, it allows traders to:
Identify potential support and resistance levels.
Visualize price behavior relative to RSI thresholds.
Spot breakout opportunities when price exceeds predefined levels.

Advanced Divergence IndicatorAdvanced Divergence Indicator
Unlock the full potential of your trading strategy with the Advanced Divergence Indicator, a powerful tool designed to identify and analyze bullish and bearish divergences using multiple technical indicators. Whether you're a seasoned trader or just starting out, this indicator provides clear, actionable signals to help you make informed trading decisions.
What It Does
The Advanced Divergence Indicator detects divergences between price movements and key technical indicators, specifically the Relative Strength Index (RSI) and On-Balance Volume (OBV). Divergence occurs when the price trends in one direction while the indicator trends in the opposite direction, signaling potential reversals or continuations in the market.
Key Features
Multi-Indicator Analysis
RSI Divergence: Identifies bullish and bearish divergences using the RSI, helping you spot potential reversals based on momentum.
OBV Divergence: Utilizes OBV to detect divergences related to volume flow, providing insights into the strength behind price movements.
Bullish and Bearish Signals
Bullish Divergence: Signals when indicators show higher lows while the price forms lower lows, suggesting a potential upward reversal.
Bearish Divergence: Alerts when indicators display lower highs while the price creates higher highs, indicating a possible downward reversal.
Signal Strength Classification
Standard Signals: Represent typical divergence occurrences, marked with green (bullish) and red (bearish) labels.
Strong Signals: Highlighted with yellow (strong bullish) and blue (strong bearish) labels when divergences coincide with overbought or oversold conditions, enhancing signal reliability.
Customizable Settings
Indicator Selection: Choose to enable RSI, OBV, or both based on your trading preferences.
Pivot Points: Adjust the number of bars left and right to fine-tune pivot detection for more accurate divergence identification.
Range Configuration: Set minimum and maximum bar ranges to control the sensitivity of divergence detection, suitable for different timeframes and trading styles.
Noise Cancellation: Reduce false signals by enabling noise filtering, ensuring that only significant divergences are highlighted.
Visual Clarity
Color-Coded Labels: Easily distinguish between different types of divergences with intuitive color codes—green for bullish, red for bearish, yellow for strong bullish, and blue for strong bearish signals.
Clean Chart Display: The indicator overlays seamlessly on your chart without clutter, ensuring that signals are easily identifiable without distracting from price action.
Real-Time Alerts
Custom Alert Conditions: Receive instant notifications for bullish and bearish divergences, enabling you to act promptly on potential trading opportunities.
Combined Alerts: Get alerts for either bullish or bearish signals, or both, based on your selected criteria.
How to Use
Add the Indicator to Your Chart
Apply the Advanced Divergence Indicator to your desired chart and timeframe.
Configure Settings
Select Indicators: Choose to enable RSI, OBV, or both under the "Indicator Settings" group.
Adjust Parameters: Customize RSI length, pivot points, and divergence ranges to match your trading strategy and the specific asset you are analyzing.
Enable Noise Cancellation: Activate this feature to filter out minor divergences and focus on more significant signals.
Interpret the Signals
Bullish Signals: Look for green or yellow labels below the price bars indicating potential upward reversals.
Bearish Signals: Identify red or blue labels above the price bars signaling possible downward reversals.
Strong Signals: Pay special attention to yellow and blue labels as they denote stronger divergences with higher reliability.
Set Up Alerts
Configure alert conditions within the indicator to receive real-time notifications when bullish or bearish divergences are detected, ensuring you never miss a trading opportunity.
Why Choose Advanced Divergence Indicator
Comprehensive Analysis : By combining RSI and OBV, the indicator provides a more robust analysis compared to single-indicator tools, enhancing the accuracy of divergence detection.
Flexibility : Highly customizable settings allow traders to tailor the indicator to their unique strategies and market conditions.
User-Friendly : Clear labels and color codes make it easy for traders of all levels to understand and act on the signals.
Reliability : Strong signal classification and noise cancellation features help reduce false positives, providing more trustworthy trading signals.

LibraryDivergenceV6LibraryDivergenceV6
Enhance your trading strategies with LibraryDivergenceV6, a comprehensive Pine Script library designed to simplify and optimize the detection of bullish and bearish divergences across multiple technical indicators. Whether you're developing your own indicators or seeking to incorporate robust divergence analysis into your trading systems, this library provides the essential tools and functions to accurately identify potential market reversals and continuations.
Overview
LibraryDivergenceV6 offers a suite of functions that detect divergences between price movements and key technical indicators such as the Relative Strength Index (RSI) and On-Balance Volume (OBV). By automating the complex calculations involved in divergence detection, this library enables traders and developers to implement reliable and customizable divergence strategies with ease.
Key Features
Comprehensive Divergence Detection
Bullish Divergence: Identifies instances where the indicator forms higher lows while the price forms lower lows, signaling potential upward reversals.
Bearish Divergence: Detects situations where the indicator creates lower highs while the price forms higher highs, indicating possible downward reversals.
Overbought and Oversold Conditions: Differentiates between standard and strong divergences by considering overbought and oversold levels, enhancing signal reliability.
Multi-Indicator Support
RSI (Relative Strength Index): Analyze momentum-based divergences to spot potential trend reversals.
OBV (On-Balance Volume): Incorporate volume flow into divergence analysis for a more comprehensive market perspective.
Customizable Parameters
Pivot Points Configuration: Adjust the number of bars to the left and right for pivot detection, allowing fine-tuning based on different timeframes and trading styles.
Range Settings: Define minimum and maximum bar ranges to control the sensitivity of divergence detection, reducing false signals.
Noise Cancellation: Enable or disable noise filtering to focus on significant divergences and minimize minor fluctuations.
Flexible Usage
Exported Functions: Easily integrate divergence detection into your custom indicators or trading strategies with exported functions such as DivergenceBull, DivergenceBear, DivergenceBullOversold, and DivergenceBearOverbought.
Occurrence Handling: Specify which occurrence of a divergence to consider (e.g., most recent, previous) for precise analysis.
Optimized Performance
Efficient Calculations: Designed to handle multiple occurrences and pivot points without compromising script performance.
Line Management: Automatically creates and deletes trend lines based on divergence conditions, ensuring a clean and uncluttered chart display.

GocchiMulti-Indicator: RSI & Moving Averages
This versatile TradingView indicator combines two essential tools for technical analysis—Relative Strength Index (RSI) and Moving Averages (MAs)—into one comprehensive solution. It is designed for traders seeking flexibility, customization, and efficiency in their charting experience.
Features:
Relative Strength Index (RSI):
Customizable RSI length.
Adjustable overbought and oversold levels.
Selectable source input (e.g., close, open, high, low).
Visual levels for overbought and oversold zones, aiding in quick trend and momentum identification.
Three Moving Averages:
Three independently customizable moving averages.
Options for Simple Moving Average (SMA) or Exponential Moving Average (EMA) for each line.
Adjustable lengths for short-, medium-, and long-term trend tracking.
Visual Enhancements:
Clear, color-coded plots for RSI and each moving average.
Overbought and oversold zones are highlighted with horizontal dotted lines.
Alerts:
Get notified when RSI crosses above the overbought level or below the oversold level.
Alerts help traders stay on top of potential market reversals or breakout opportunities.
Use Cases:
RSI Analysis: Spot overbought or oversold conditions to identify potential reversals.
Trend Following: Use moving averages to confirm trends or identify crossovers for potential entry and exit points.
Custom Strategies: Tailor the settings to fit specific trading styles, such as scalping, swing trading, or long-term investing.
This all-in-one indicator streamlines your analysis by reducing the need for multiple overlays, making your charts cleaner and more actionable. Whether you're a novice or an experienced trader, this tool provides the flexibility and insights you need to succeed in any market condition.

Money Flow ExtendedMoney Flow Extended (MF)
Definition
The Money Flow Extended (MF) indicator brings together the functionality of the Money Flow Index indicator (MFI) , a tool created by Gene Quong and Avrum Soudack and used in technical analysis for measuring buying and selling pressure, and The Relative Strength Index (RSI) , a well versed momentum based oscillator created by J.Welles Wilder Jr., which is used to measure the speed (velocity) as well as the change (magnitude) of directional price movements.
History
As the Money Flow Index (MFI) is quite similar to The Relative Strength Index (RSI), essentially the RSI with the added aspect of volume, adding a Moving Average, divergence calculation, oversold and overbought gradients, facilitates the transition from RSI, making the use of MFI pretty similar.
What to look for
Overbought/Oversold
When momentum and price rise fast enough, at a high enough level, eventual the security will be considered overbought. The opposite is also true. When price and momentum fall far enough, they can be considered oversold. Traditional overbought territory starts above 80 and oversold territory starts below 20. These values are subjective however, and a technical analyst can set whichever thresholds they choose.
Divergence
MF Divergence occurs when there is a difference between what the price action is indicating and what MF is indicating. These differences can be interpreted as an impending reversal. Specifically, there are two types of divergences, bearish and bullish.
Bullish MFI Divergence – When price makes a new low but MF makes a higher low.
Bearish MFI Divergence – When price makes a new high but MF makes a lower high.
Failure Swings
Failure swings are another occurrence which can lead to a price reversal. One thing to keep in mind about failure swings is that they are completely independent of price and rely solely on MF. Failure swings consist of four steps and are considered to be either Bullish (buying opportunity) or Bearish (selling opportunity).
Bullish Failure Swing
MF drops below 20 (considered oversold).
MF bounces back above 20.
MF pulls back but remains above 20 (remains above oversold)
MF breaks out above its previous high.
Bearish Failure Swing
MF rises above 80 (considered overbought)
MF drops back below 80
MF rises slightly but remains below 80 (remains below overbought)
MF drops lower than its previous low.
Summary
The Money Flow Extended (MF) can be a very valuable technical analysis tool. Of course, MF should not be used alone as the sole source for a trader’s signals or setups. MF can be combined with additional indicators or chart pattern analysis to increase its effectiveness.
Inputs
Length
The time period to be used in calculating the MF. 14 is the default.
Pivot Loopback
After how many bars you want the divergence to show, on the scale of 1-5. 5 is the default.
Calculate Divergence
Calculating divergences is needed in order for divergence alerts to fire.
Moving Average section
You can learn more about the inputs in the "Moving Average" section in this Help Center article .
Style
MF
Can toggle the visibility of the MF as well as the visibility of a price line showing the actual current value of the MF. Can also select the MF Line's color, line thickness and visual style.
MF-based MA
Can toggle the visibility of the MF-based MA as well as the visibility of a price line showing the actual current MA value. Can also select its color, line thickness and line style.
MF Upper Band
Can toggle the visibility of the Upper Band as well as sets the boundary, on the scale of 1-100, for the Upper Band (80 is the default). The color, line thickness and line style can also be determined.
MF Middle Band
Can toggle the visibility of the Middle Band as well as sets the boundary, on the scale of 1-100, for the Middle Band (50 is the default). The color, line thickness and line style can also be determined.
MF Lower Band
Can toggle the visibility of the Lower Band as well as sets the boundary, on the scale of 1-100, for the Lower Band (20 is the default). The color, line thickness and line style can also be determined.
MF Background Fill
Toggles the visibility of a Background color within the MF's boundaries. Can also change the Color itself as well as the opacity.
Overbought Gradient Fill
Can toggle the visibility of the Overbought Gradient Fill. Can also select its colors combination.
Oversold Gradient Fill
Can toggle the visibility of the Oversold Gradient Fill. Can also select its colors combination.
Precision
Sets the number of decimal places to be left on the indicator's value before rounding up. The higher this number, the more decimal points will be on the indicator's value.

EMA RSI Trend Reversal Ver.1Overview:
The EMA RSI Trend Reversal indicator combines the power of two well-known technical indicators—Exponential Moving Averages (EMAs) and the Relative Strength Index (RSI)—to identify potential trend reversal points in the market. The strategy looks for key crossovers between the fast and slow EMAs, and uses the RSI to confirm the strength of the trend. This combination helps to avoid false signals during sideways market conditions.
How It Works:
Buy Signal:
The Fast EMA (9) crosses above the Slow EMA (21), indicating a potential shift from a downtrend to an uptrend.
The RSI is above 50, confirming strong bullish momentum.
Visual Signal: A green arrow below the price bar and a Buy label are plotted on the chart.
Sell Signal:
The Fast EMA (9) crosses below the Slow EMA (21), indicating a potential shift from an uptrend to a downtrend.
The RSI is below 50, confirming weak or bearish momentum.
Visual Signal: A red arrow above the price bar and a Sell label are plotted on the chart.
Key Features:
EMA Crossovers: The Fast EMA crossing above the Slow EMA signals potential buying opportunities, while the Fast EMA crossing below the Slow EMA signals potential selling opportunities.
RSI Confirmation: The RSI helps confirm trend strength—values above 50 indicate bullish momentum, while values below 50 indicate bearish momentum.
Visual Cues: The strategy uses green arrows and red arrows along with Buy and Sell labels for clear visual signals of when to enter or exit trades.
Signal Interpretation:
Green Arrow / Buy Label: The Fast EMA (9) has crossed above the Slow EMA (21), and the RSI is above 50. This is a signal to buy or enter a long position.
Red Arrow / Sell Label: The Fast EMA (9) has crossed below the Slow EMA (21), and the RSI is below 50. This is a signal to sell or exit the long position.
Strategy Settings:
Fast EMA Length: Set to 9 (this determines how sensitive the fast EMA is to recent price movements).
Slow EMA Length: Set to 21 (this smooths out price movements to identify the broader trend).
RSI Length: Set to 14 (default setting to track momentum strength).
RSI Level: Set to 50 (used to confirm the strength of the trend—above 50 for buy signals, below 50 for sell signals).
Risk Management (Optional):
Use take profit and stop loss based on your preferred risk-to-reward ratio. For example, you can set a 2:1 risk-to-reward ratio (2x take profit for every 1x stop loss).
Backtesting and Optimization:
Backtest the strategy on TradingView by opening the Strategy Tester tab. This will allow you to see how the strategy would have performed on historical data.
Optimization: Adjust the EMA lengths, RSI period, and risk-to-reward settings based on your asset and time frame.
Limitations:
False Signals in Sideways Markets: Like any trend-following strategy, this indicator may generate false signals during periods of low volatility or sideways movement.
Not Suitable for All Market Conditions: This indicator performs best in trending markets. It may underperform in choppy or range-bound markets.
Strategy Example:
XRP/USD Example:
If you're trading XRP/USD and the Fast EMA (9) crosses above the Slow EMA (21), while the RSI is above 50, the indicator will signal a Buy.
Conversely, if the Fast EMA (9) crosses below the Slow EMA (21), and the RSI is below 50, the indicator will signal a Sell.
Bitcoin (BTC/USD):
On the BTC/USD chart, when the indicator shows a green arrow and a Buy label, it’s signaling a potential long entry. Similarly, a red arrow and Sell label indicate a short entry or exit from a previous long position.
Summary:
The EMA RSI Trend Reversal Indicator helps traders identify potential trend reversals with clear buy and sell signals based on the EMA crossovers and RSI confirmations. By using green arrows and red arrows, along with Buy and Sell labels, this strategy offers easy-to-understand visual signals for entering and exiting trades. Combine this with effective risk management and backtesting to optimize your trading performance.

RSI Divergence + Sweep + Signal + Alerts Toolkit [TrendX_]The RSI Toolkit is a powerful set of tools designed to enhance the functionality of the traditional Relative Strength Index (RSI) indicator. By integrating advanced features such as Moving Averages, Divergences, and Sweeps, it helps traders identify key market dynamics, potential reversals, and newly-approach trading stragies.
The toolkit expands on standard RSI usage by incorporating features from smart money concepts (Just try to be creative 🤣 Hope you like it), providing a deeper understanding of momentum, liquidity sweeps, and trend reversals. It is suitable for RSI traders who want to make more informed and effective trading decisions.
💎 FEATURES
RSI Moving Average
The RSI Moving Average (RSI MA) is the moving average of the RSI itself. It can be customized to use various types of moving averages, including Simple Moving Average (SMA), Exponential Moving Average (EMA), Relative Moving Average (RMA), and Volume-Weighted Moving Average (VWMA).
The RSI MA smooths out the RSI fluctuations, making it easier to identify trends and crossovers. It helps traders spot momentum shifts and potential entry/exit points by observing when the RSI crosses above or below its moving average.
RSI Divergence
RSI Divergence identifies discrepancies between price action and RSI momentum. There are two types of divergences: Regular Divergence - Indicates a potential trend reversal; Hidden Divergence - Suggests the continuation of the current trend.
Divergence is a critical signal for spotting weakness or strength in a trend. Regular divergence highlights potential trend reversals, while hidden divergence confirms trend continuation, offering traders valuable insights into market momentum and possible trade setups.
RSI Sweep
RSI Sweep detects moments when the RSI removes liquidity from a trend structure by sweeping above or below the price at key momentum level crossing. These sweeps are overlaid on the RSI chart for easier visualized.
RSI Sweeps are significant because they indicate potential turning points in the market. When RSI sweeps occur: In an uptrend - they suggest buyers' momentum has peaked, possibly leading to a reversal; In a downtrend - they indicate sellers’ momentum has peaked, also hinting at a reversal.
(Note: This feature incorporates Liquidity Sweep concepts from Smart Money Concepts into RSI analysis, helping RSI traders identify areas where liquidity has been removed, which often precedes a trend reversal)
🔎 BREAKDOWN
RSI Moving Average
How MA created: The RSI value is calculated first using the standard RSI formula. The MA is then applied to the RSI values using the trader’s chosen type of MA (SMA, EMA, RMA, or VWMA). The flexibility to choose the type of MA allows traders to adjust the smoothing effect based on their trading style.
Why use MA: RSI by itself can be noisy and difficult to interpret in volatile markets. Applying moving average would provide a smoother, more reliable view of RSI trends.
RSI Divergence
How Regular Divergence created: Regular Divergence is detected when price forms HIGHER highs while RSI forms LOWER highs (bearish divergence) or when price forms LOWER lows while RSI forms HIGHER lows (bullish divergence).
How Hidden Divergence created: Hidden Divergence is identified when price forms HIGHER lows while RSI forms LOWER lows (bullish hidden divergence) or when price forms LOWER highs while RSI forms HIGHER highs (bearish hidden divergence).
Why use Divergence: Divergences provide early warning signals of a potential trend change. Regular divergence helps traders anticipate reversals, while hidden divergence supports trend continuation, enabling traders to align their trades with market momentum.
RSI Sweep
How Sweep created: Trend Structure Shift are identified based on the RSI crossing key momentum level of 50. To track these sweeps, the indicator pinpoints moments when liquidity is removed from the Trend Structure Shift. This is a direct application of Liquidity Sweep concepts used in Smart Money theories, adapted to RSI.
Why use Sweep: RSI Sweeps are created to help traders detect potential trend reversals. By identifying areas where momentum has exhausted during a certain trend direction, the indicator highlights opportunities for traders to enter trades early in a reversal or continuation phase.
⚙️ USAGES
Divergence + Sweep
This is an example of combining Devergence & Sweep in BTCUSDT (1 hour)
Wait for a divergence (regular or hidden) to form on the RSI. After the divergence is complete, look for a sweep to occur. A potential entry might be formed at the end of the sweep.
Divergences indicate a potential trend change, but confirmation is required to ensure the setup is valid. The RSI Sweep provides that confirmation by signaling a liquidity event, increasing the likelihood of a successful trade.
Sweep + MA Cross
This is an example of combining Devergence & Sweep in BTCUSDT (1 hour)
Wait for an RSI Sweep to form then a potential entry might be formed when the RSI crosses its MA.
The RSI Sweep highlights a potential turning point in the market. The MA cross serves as additional confirmation that momentum has shifted, providing a more reliable and more potential entry signal for trend continuations.
DISCLAIMER
This indicator is not financial advice, it can only help traders make better decisions. There are many factors and uncertainties that can affect the outcome of any endeavor, and no one can guarantee or predict with certainty what will occur. Therefore, one should always exercise caution and judgment when making decisions based on past performance.

XAUUSD Trend Strategy### Description of the XAUUSD Trading Strategy with Pine Script
This strategy is designed to trade gold (**XAUUSD**) using proven technical analysis principles. It combines key indicators such as **Exponential Moving Averages (EMA)**, the **Relative Strength Index (RSI)**, and **Bollinger Bands** to identify trading opportunities in trending market conditions.
---
#### Objective:
To maximize profits by identifying trend-aligned entry points while minimizing risks through well-defined Stop Loss and Take Profit levels.
---
### How It Works
1. **Indicators Used:**
- **Exponential Moving Averages (EMA):** Tracks short-term and long-term trends to confirm market direction.
- **Relative Strength Index (RSI):** Detects overbought or oversold conditions for potential reversals or trend continuation.
- **Bollinger Bands:** Measures volatility to identify breakout or reversion points.
2. **Entry Rules:**
- **Long (Buy):** Triggered when:
- The short-term EMA crosses above the long-term EMA (bullish trend confirmation).
- RSI exits oversold territory (<30), signaling buying momentum.
- The price breaks above the upper Bollinger Band, indicating a strong trend.
- **Short (Sell):** Triggered when:
- The short-term EMA crosses below the long-term EMA (bearish trend confirmation).
- RSI exits overbought territory (>70), signaling selling momentum.
- The price breaks below the lower Bollinger Band, indicating a strong downtrend.
3. **Risk Management:**
- **Stop Loss:** Automatically calculated based on a percentage of equity risk (customizable via inputs).
- **Take Profit:** Defined using a risk-to-reward ratio, ensuring consistent profitability when trades succeed.
4. **Visualization:**
- The chart displays the EMAs, Bollinger Bands, and entry/exit points for clear analysis.
---
### Key Features:
- **Customizable Parameters:** You can adjust EMAs, RSI thresholds, Bollinger Band settings, and risk levels to suit your trading style.
- **Alerts:** Automatic alerts for potential trade setups.
- **Backtesting-Ready:** Easily test historical performance on TradingView.
---
This strategy is ideal for gold traders looking for a systematic, rule-based approach to trading trends with minimal emotional interference.

5-Minute Buy/Sell SignalThe 5-Minute Buy/Sell Signal Indicator is designed to help short-term traders identify potential buy and sell opportunities on a 5-minute chart using a combination of multiple technical indicators. This indicator integrates the following key components to generate buy and sell signals:
MACD (Moving Average Convergence Divergence):
The MACD helps identify the strength and direction of the market trend by comparing the difference between short-term and long-term moving averages. A positive MACD histogram indicates bullish momentum, while a negative histogram indicates bearish momentum.
RSI (Relative Strength Index):
The RSI is a momentum oscillator that measures the speed and change of price movements. The indicator is used to determine overbought or oversold conditions:
Oversold (below 30): Potential buy signal.
Overbought (above 70): Potential sell signal.
EMA (Exponential Moving Average):
The 50-period EMA is used to determine the prevailing trend. When the price is above the EMA, it indicates a bullish trend; when it is below the EMA, it indicates a bearish trend.
Volume:
The indicator incorporates volume analysis to confirm the strength of signals. Signals are only considered valid when the current volume exceeds the average volume over the last 20 periods, ensuring that there is sufficient market participation to support the move.
Signal Generation:
Buy Signal:
The signal is generated when:
MACD histogram is positive (bullish momentum).
RSI is below the oversold level (indicating a potential reversal).
The price is above the 50-period EMA (indicating an uptrend).
Current volume is higher than the 20-period volume moving average (confirming the strength of the buy signal).
Sell Signal:
The signal is generated when:
MACD histogram is negative (bearish momentum).
RSI is above the overbought level (indicating a potential reversal).
The price is below the 50-period EMA (indicating a downtrend).
Current volume is higher than the 20-period volume moving average (confirming the strength of the sell signal).
Signal Display:
Buy Signal: A green "BUY" label appears below the bar when all buy conditions are met.
Sell Signal: A red "SELL" label appears above the bar when all sell conditions are met.
Usage:
This indicator is specifically designed for 5-minute charts, making it ideal for scalpers and day traders who need quick, reliable signals to trade in short timeframes. By combining multiple indicators—MACD, RSI, EMA, and Volume—the system ensures that the buy or sell signals are well-confirmed, reducing the likelihood of false signals and increasing the probability of successful trades.
Alert Conditions:
Alerts can be set up for both buy and sell signals, enabling traders to be notified when the conditions for a potential trade are met, ensuring they never miss a trading opportunity.
In summary, this indicator provides a comprehensive, multi-faceted approach to identifying buy and sell opportunities, helping traders make more informed decisions based on a detailed technical analysis.
Bewakoof stock indicator**Title**: "Bewakoof Stock Indicator: Multi-Timeframe RSI and SuperTrend Entry-Exit System"
---
### Description
The **Bewakoof Stock Indicator** is an original trading tool that combines multi-timeframe RSI analysis with the SuperTrend indicator to create reliable entry and exit signals for trending markets. This indicator is designed for traders looking to follow strong trends with built-in risk management. By filtering entries through short- and long-term momentum and utilizing dynamic trailing exits, this indicator provides a structured approach to trading.
#### Indicator Components
1. **Multi-Timeframe RSI Analysis**:
- The Relative Strength Index (RSI) is calculated across three timeframes: Daily, Weekly, and Monthly.
- By examining multiple timeframes, the indicator confirms that trends align over short, medium, and long-term intervals, making buy signals more reliable.
- **Buy Condition**: All three RSI values must meet these thresholds:
- **Daily RSI > 50** – indicates short-term upward momentum,
- **Weekly RSI > 60** – signals medium-term strength,
- **Monthly RSI > 60** – confirms long-term trend alignment.
- This filtering process ensures that buy signals are generated only in stable, upward-trending markets.
2. **SuperTrend Confirmation**:
- The SuperTrend (20-period ATR with a multiplier of 2) acts as a trend filter and trailing stop mechanism.
- For a buy condition to be valid, the closing price must be above the SuperTrend level, verifying that the market is trending up.
- The combination of RSI and SuperTrend helps to avoid false signals, focusing only on well-established trends.
#### Trade Signals
- **Buy Signal**: When both the multi-timeframe RSI and SuperTrend conditions are met, a buy signal is triggered, indicated by a “BUY” label on the chart with details:
- **Entry Price**,
- **Initial Stop-Loss** (set at the SuperTrend level for risk control),
- **Target 1** – calculated with a 1:1 risk-reward ratio based on the initial stop-loss,
- **Target 2** – calculated with a 1:2 risk-reward ratio based on the initial stop-loss.
- **Exit Signals**: This indicator provides two exit strategies to protect profits:
1. **Fixed Stop-Loss**: Automatically set at the SuperTrend level at the time of entry to limit risk.
2. **Trailing Exit**: Exits are triggered if the price crosses below the SuperTrend level, adapting to potential trend reversals.
#### Labeling & Alerts
The **Bewakoof Stock Indicator** offers intuitive labeling and alert options:
- **Labels**: Buy and exit points are clearly marked, showing entry, stop-loss, and targets directly on the chart.
- **Alerts**: Custom alerts can be set for:
- **Buy signals** when both conditions are met, and
- **Exit signals** triggered by the stop-loss or trailing exit.
#### Use Case and Benefits
This indicator is ideal for trend-following traders who value risk control and trend confirmation:
- **Stronger Trend Signals**: By requiring RSI alignment across multiple timeframes, this indicator focuses only on trades with strong trend momentum.
- **Dynamic Risk Management**: Using both fixed and trailing exits enables flexible trade management, balancing risk and potential reward.
- **Simple Trade Execution**: The chart labels and alerts simplify trade decisions, making it easy to enter, manage, and exit trades.
#### How to Use
1. **Add** the Bewakoof Stock Indicator to your chart.
2. **Watch** for the "BUY" label as your entry point.
3. **Manage the trade** using the labeled stop-loss and target levels.
4. **Exit** on either a stop-loss hit or when the price crosses below the SuperTrend for a trailing exit.
The **Bewakoof Stock Indicator** is a complete solution for trend-following traders, combining the strength of multi-timeframe RSI with the SuperTrend’s trend-following capabilities. This systematic approach aims to provide high-confidence entries and effective risk management, empowering traders to follow trends with precision and control.
